
Bearish Wave Hits Solana: SOL Falls Below $140 – More Losses on the Horizon?

Solana, the leading blockchain platform, is facing a major downturn as a tidal wave sweeps through its market. This decline, driven by a combination of factors, has led the price of SOL to fall sharply below the $140 support mark.
Solana’s price has worked hard to find stability, passing through important support levels and showing further potential losses. As bearish sentiment continues to dominate, traders and investors are closely monitoring the situation, looking for signs of a possible reversal or further decline in the near future.
Technical Indicators Signal Additional Solana Losses
On the 4-hour chart, the price of SOL is starting to fall again after a failed attempt to go higher. It should also be noted here that the digital asset is still trading below the 100-day Simple Moving Average (SMA).
The 4-hour Relative Strength Index (RSI) also suggests that Solana may be ready to go lower again as the signal line of the RSI indicator is trying to pull back below 50% and become oversold.
From the 1-day chart based on current price movements, it can be observed that SOL is still active as it is still trading below the 100-day SMA. It can also be noticed here that it is trying to start down by dropping the rejection candlestick.
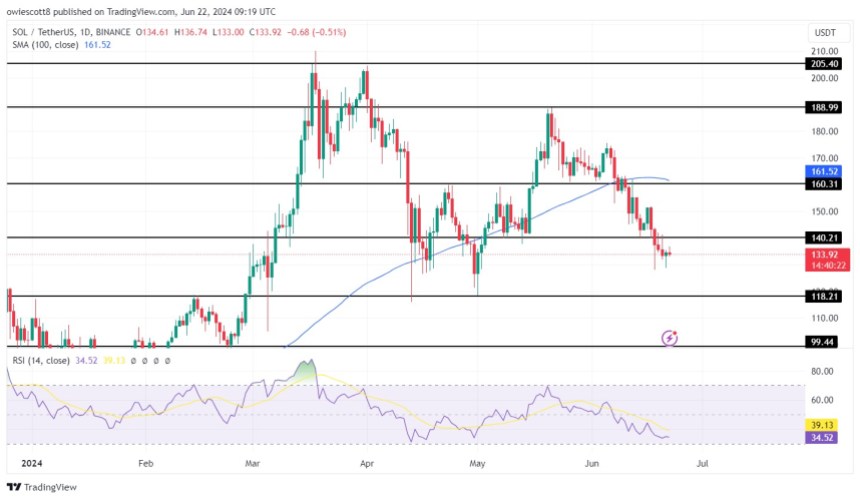
Also, the RSI indicator shows that the price of SOL may fall further as the RSI line is trending below 50% towards the oversold area. It is worth noting that from the analysis and technical indicators on both the 4-hour and 1-day charts, it can be suggested that the price of SOL may extend its decline for a while.
Potential Scenarios for SOL Price Movements
Currently, Solana has broken below $140 and is trying to move down to the $118 support level. If the price of SOL breaks this level, it will continue down to test the support level of $99 and may go ahead to test another decline if it breaks below this level of $99.
However, if it fails to go down as predicted and breaks above the $140 mark, it will start moving towards the $160 resistance level. If it does break above this resistance level, it will continue to move higher to test the $188 resistance level. In addition, Solana may see an upward climb to test the $205 resistance level on the chart if it breaks the support level above and possibly move forward to create a new high.
The price of SOL decreased by 0.57%, trading around 133 dollars in the last 24 hours, with a market capitalization of more than $61 billion and a trading volume of more than 1.9 billion as of the time of writing. There was a 12.94% increase in market capitalization in the last day despite the trading volume falling by 9.84%.


 dengan Potensi Rebound Kuat")
