

Bitcoin is currently facing a a significant decline, and its price is slowly approaching the important $60,000 mark. Market sentiment has turned increasingly bearish, driven by a combination of macroeconomic factors and the recent increase in selling pressure.
This change has seen Bitcoin struggle to maintain high levels, causing concern among investors and traders. As the bears rule, the $60,000 limit becomes the focal pointmany are watching closely to see if the crypto asset can find support or continue its downward trend.
With the help of technical indicators, this analysis focuses on analyzing the current action of the Bitcoin price and its impact on the future of the asset focusing on the 4-hour and 1-day period.
As of this writing, Bitcoin’s market capitalization is over $1.2 trillion, with a trading volume of over $17 billion. The price of the cryptocurrency is now down 3.11%, trading at around $62,334. Despite a 3.09% drop in market capitalization, there was a 96.46% increase in trading volume on the last day.
An overview of the current Bitcoin market
Currently, as can be seen on the 4-hour chart, Bitcoin price is active and has fallen well below the $64,515 support level. It can also be noted here that the price is falling towards the support level of $60,158.
Another confirmation of the above claim is the 4-hour Relative Strength Index (RSI) as the signal line of the indicator has dropped significantly below 50% and is currently trending in the oversold phase. This indicates that there is a chance for further price declines.
The price of Bitcoin on the 1-day chart is also active as it is currently trading below the 100-day Simple Moving Average (SMA) down to the $60,158 support level with strong bearish momentum.
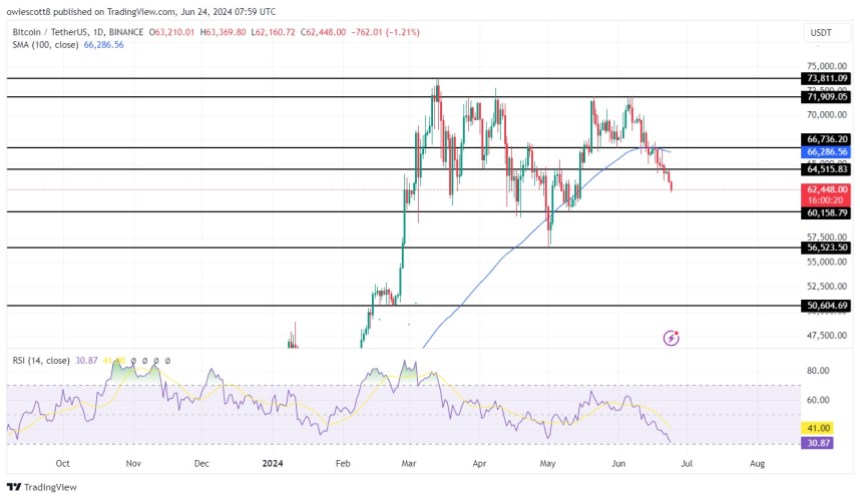
Finally, with the formation of the 1-day RSI, it can be suggested that the price of BTC poses an additional risk of extending its decline as the signal line of the indicator that has fallen below 50% is actively trending close to the oversold area.
Important Support Levels: Why $60,158 Matters
Currently, BTC is falling to the support level of $60,158. Two events can happen if the price reaches this level, either it receives a rejection and starts to go higher or it breaks this level and continues to go down.
Therefore, if there is a rejection at the support level of $60,158, BTC may start moving higher towards the resistance level of $64,515. If this level is breached, the crypto asset may face further price growth towards the resistance level of $71,909 and other levels above.
On the other hand, if the price of BTC breaks below this support level, it will continue to fall to test the support level of $56,524. If this level is breached, Bitcoin may refuse further, testing the $50,604 support level and possibly lower levels.
Featured image from iStock, chart from Tradingview.com
Source link


 dengan Potensi Rebound Kuat")
