
Dogecoin Goes To The Moon? Crypto Analyst Predicts 440% Price Rally

In the latest technical analysis of the famous crypto analyst Big Mike (@Michael_EWpro), the possibility of a huge increase in Dogecoin (DOGE) was revealed. Using a combination of Elliott Wave theory, Fibonacci retracement levels, and key indicators such as RSI and MACD, the analysis reveals a bullish trend that could have a major impact on Dogecoin markets.
Why Dogecoin Could Skyrocket 440%
The three-day chart of Dogecoin, as traded on Binance, shows a complex structure that suggests the use of the Elliott Wave theory, which is important for predicting price movements based on investor logic and momentum. The chart indicates the end of a correction phase and the beginning of a potentially bullish trend.
The Elliott Wave pattern on the chart identifies several key stages. Wave 1 started at a low level below $0.08, marking the beginning of bullish momentum and reached $0.2196.
Related Reading
After this, the chart shows a correction phase characterized by an ABC pattern. This pattern is key to the Elliott Wave theory, which represents a market correction after an initial price increase. Here, Wave A begins its correction with a decline to $0.1189, followed by a slight rebound in Wave B to $0.17, and a significant decline in Wave C, setting the stage for the completion of Wave 2.
This correction phase is important as it lays the foundation for the expected Bullish Wave 3. However, Big Mike predicts that wave 2 may push the price of Dogecoin down to $0.1032 (representing the peak of wave 1) before the start of wave 3.
The Fibonacci retracement tool is used to identify potential future support or resistance levels. In this analysis, the 0.618 Fibonacci level at $0.2196 is very important as it indicates the height of wave 1 and a strong resistance point that may influence the price recovery in the future.
Related Reading
The analysis also points to potential long-term resistance levels at the 1, 1.414, and 1.618 Fibonacci retracements, priced at $0.3208, $0.4839, and $0.5925 respectively. These levels can play important roles if the bullish Wave 3 happens as expected.
Historically, the third wave in the Elliott Wave theory is usually the strongest and largest, indicating the great power of the DOGE. This wave aims to challenge and possibly surpass long-term resistance levels. Big Mike predicts that wave 3 could reach near the Fibonacci extension level of 1.414.
A potential Wave 4 could see a pullback to $0.3208 (Fibonacci level 1.0), while Wave 5 could drive the price of Dogecoin to $0.6723, representing a 440% increase from current levels. Notably, this is also the peak of the superior wave 3.
The Relative Strength Index (RSI), which is currently below 50, suggests a neutral position for DOGE, indicating the potential for an upward trend as market sentiment changes to buying. The Moving Average Convergence Divergence (MACD) is approaching the bullish boundary, usually indicating rising momentum. This indicator is important as it may confirm the beginning of the proposed strong upward trend.
At press time, DOGE traded at $0.1248.
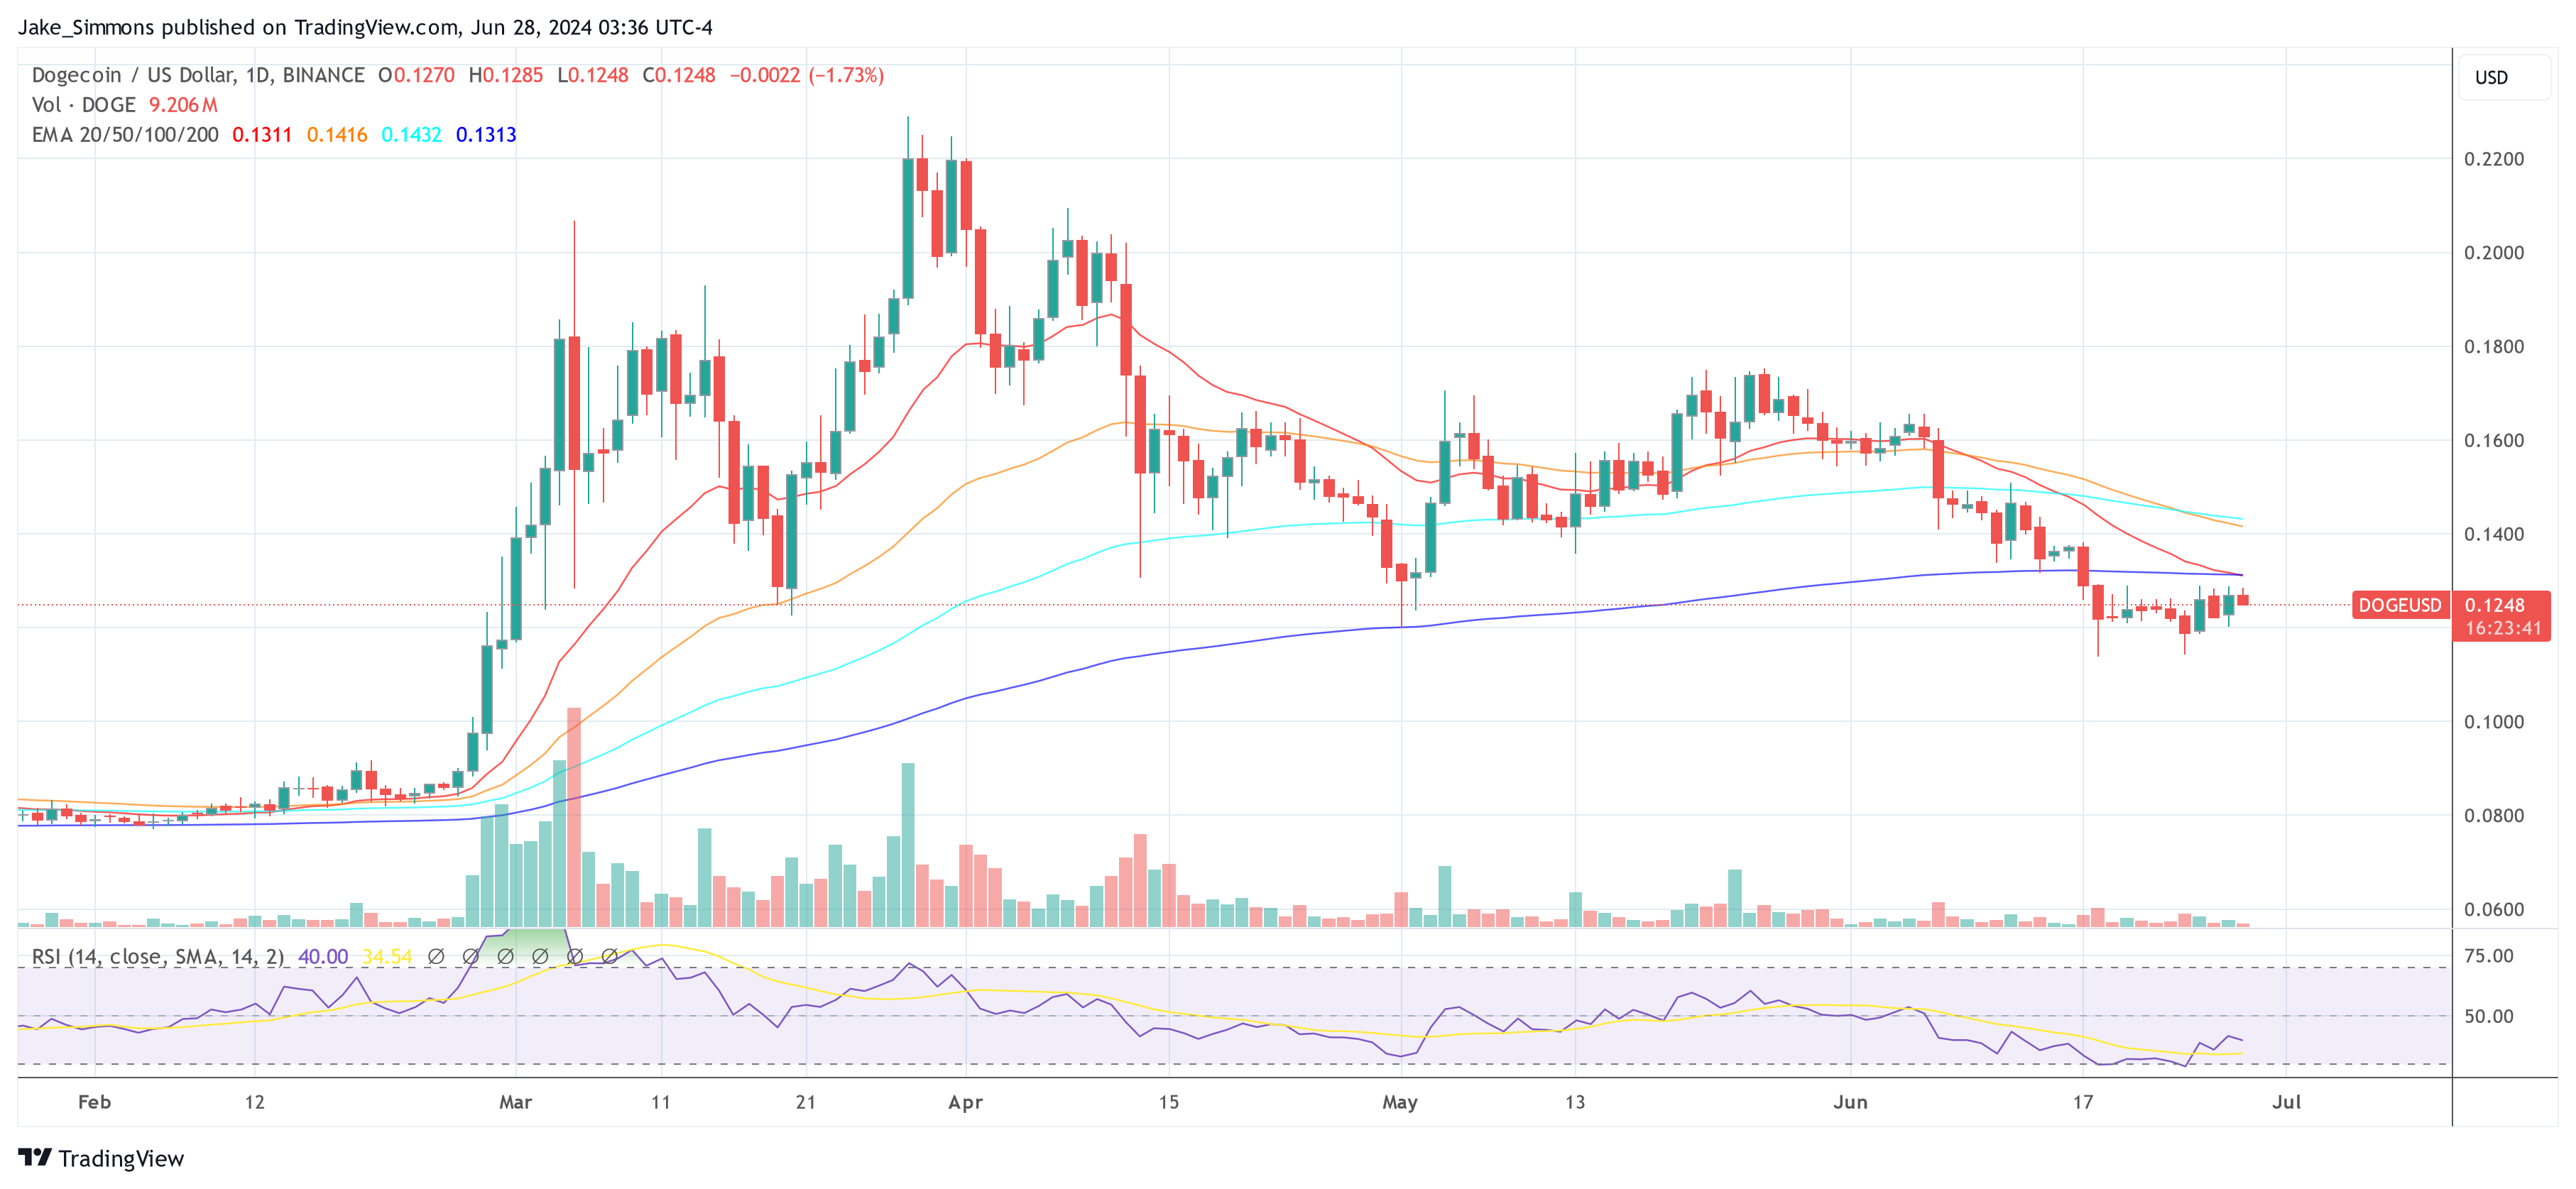
The featured image was created with DALL·E, a chart from TradingView.com
Source link


 dengan Potensi Rebound Kuat")
